
Memory analysis is such a huge subject that putting everything into one episode will make your morning coffee last for the whole day! And we still need to work, right? 🙂
Acquiring and analyzing physical memory as done by forensics professionals is a skill crucial to understanding how an operating system works or worked during the incident. For hobbyists, working with memory can be useful to perform troubleshooting and understand how certain solutions work. The valuable content contains evidence of user actions, hacker’s tasks, malicious code behaviors, and the story of what happened on a system. Within these 3 parts of memory analysis Hacking Summer Camp episodes, you will become familiar with the methods for memory acquisition, techniques for grabbing the juicy data, and why it is so amazing to find someone’s memory dump!
First of all, to start playing with memory dumps and analysis we need the appropriate tools.
Let’s start with the basics. You will need the following tools:
– DumpIt (https://my.comae.com/login);
– Volatility (https://github.com/volatilityfoundation)
– Windows 10 x64 running on Virtual Machine or just live operating system
So, let’s begin!
In the Windows 10 operating systems that you plan to create a dump for, open cmd.exe, and type a couple of commands that produce results (dir, netstat etc.) – we will need that for later analysis. To create a full memory dump of your system simply run the DumpIt.exe tool and enter ‘y’ when asked. The dump file is created along with the tool by default in the dmp format (If you want to create a dump in RAW format run cmd with administrative privileges, navigate to DumpIt.exe and execute it with DumpIt.exe /T RAW). Create ‘Dumps’ folder wherever it is comfortable for you – we will put our dumps there. Now move the file to the created folder and rename if necessary, for me it is: c:\dumps\win10.dmp.
The next stage is to have a look at what is in the memory dump file. Before we proceed we need to install the appropriate tools:
Python Installation:
For Windows, you will need to download Python 2.7 from here: https://www.python.org/downloads/windows/
Once you installed python 2.7 executable you need to download pip from here: https://bootstrap.pypa.io/get-pip.py
Then install volatility dependencies with pip command as seen below. Additionally, you will need to install distorm3 from this executable: https://github.com/gdabah/distorm/releases/download/v3.3.4/distorm3-3.3.4.win-amd64.exe
>pip –version
To install needed dependencies, we can now use pip
>pip install wheel
(https://github.com/gdabah/distorm)
>pip install distorm3
(https://github.com/pycrypto/pycrypto)
>pip install pycrypto
Volatility Installation: Download volatility from the official github https://github.com/volatilityfoundation/volatility
In the cmd or terminal move to the directory containing the sources of the Volatility.
Now we are ready for the analysis!
If you need help with usage of volatility use:
>vol.py -h
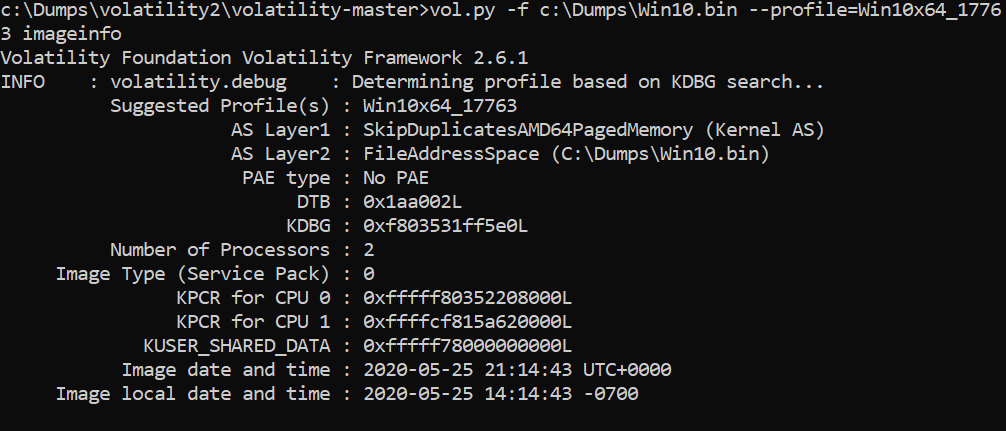
Start your journey with getting some information about your dump:
>vol.py -f c:\dumps\win10.bin –profile=Win10x64_17763 imageinfo
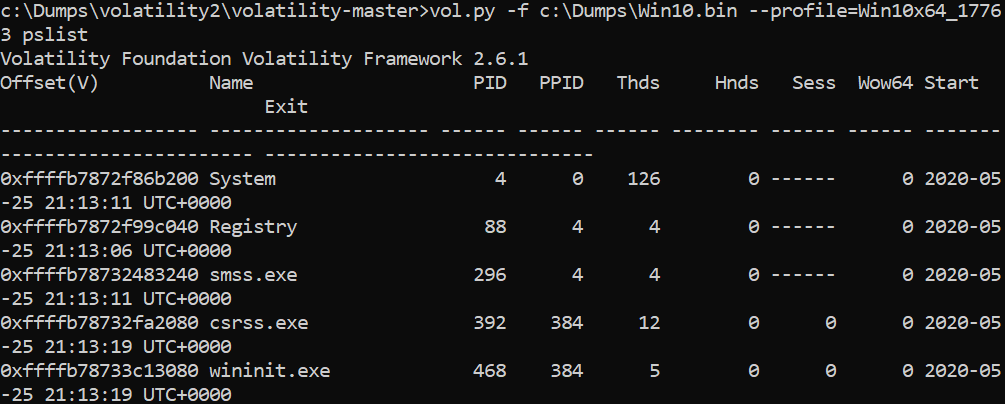
Then get the list of active processes:
>vol.py -f c:\dumps\win10.bin –profile=Win10x64_17763 pslist
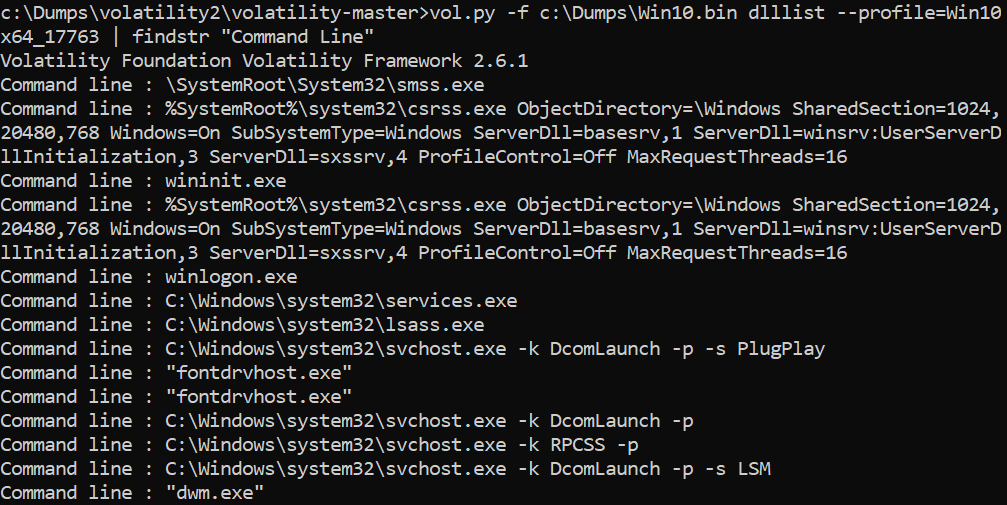
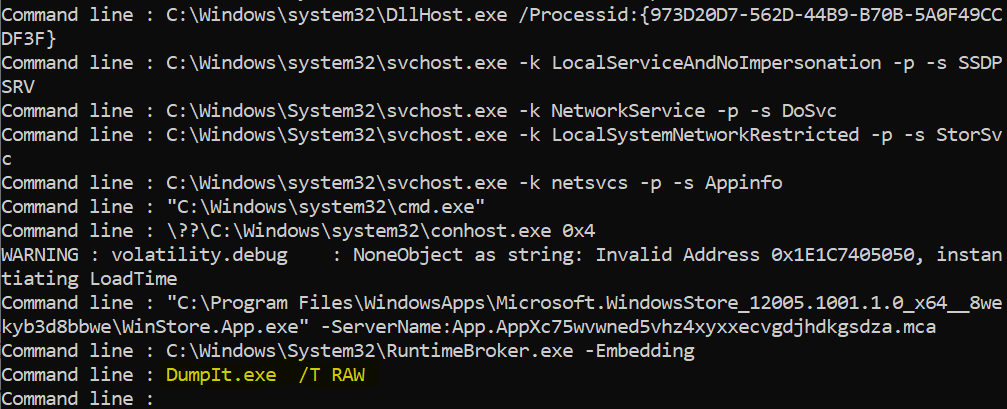
And the command lines that you or the system have used before:
>vol.py -f c:\dumps\win10.bin dlllist –profile=Win10x64_17763 | findstr “Command Line”
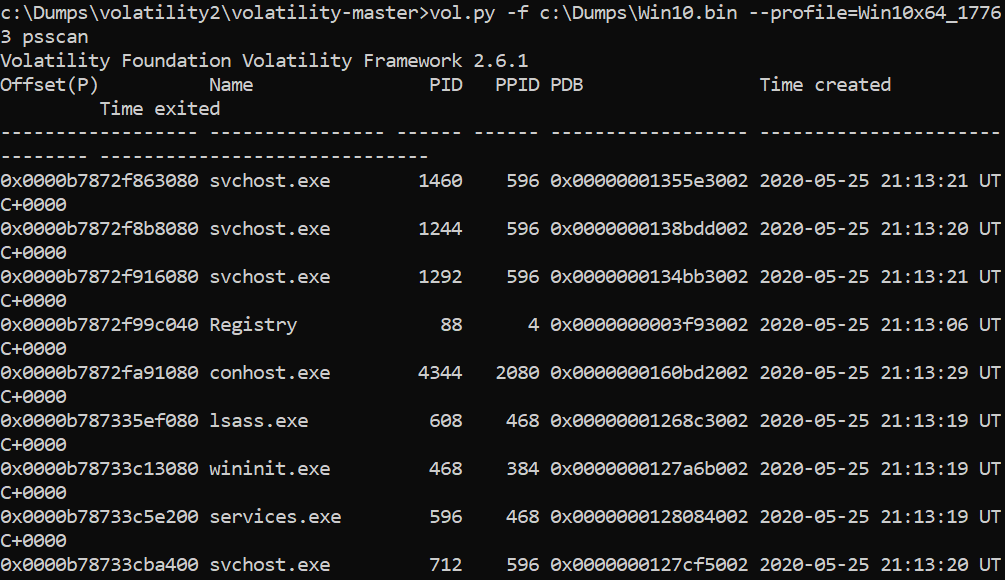
When playing with this, you may wish to dive a bit deeper, right? If you think that there are some processes that are hiding:
>vol.py -f c:\dumps\win10.bin –profile=Win10x64_17763 psscan
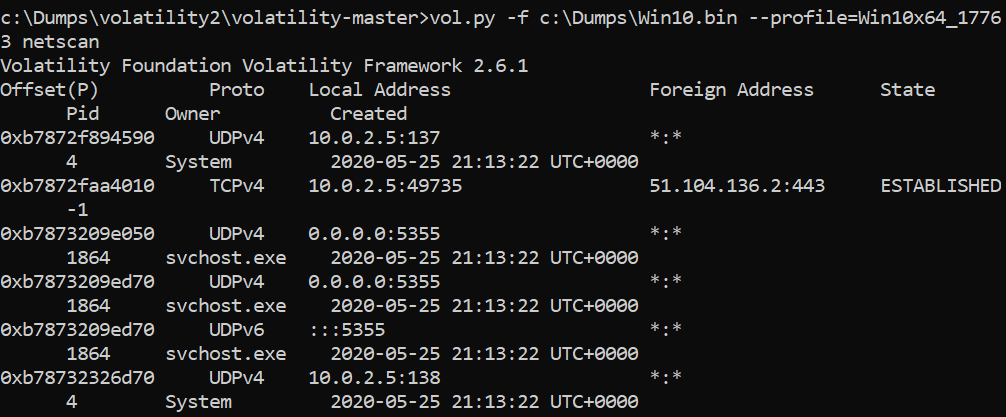
Let’s check the network connections that were made when making a dump:
>vol.py -f c:\dumps\win10.bin –profile=Win10x64_17763 netscan
Now it’s time to check what commands were run through cmd.exe
>vol.py -f c:\dumps\win10.bin –profile=Win10x64_17763 svcscan
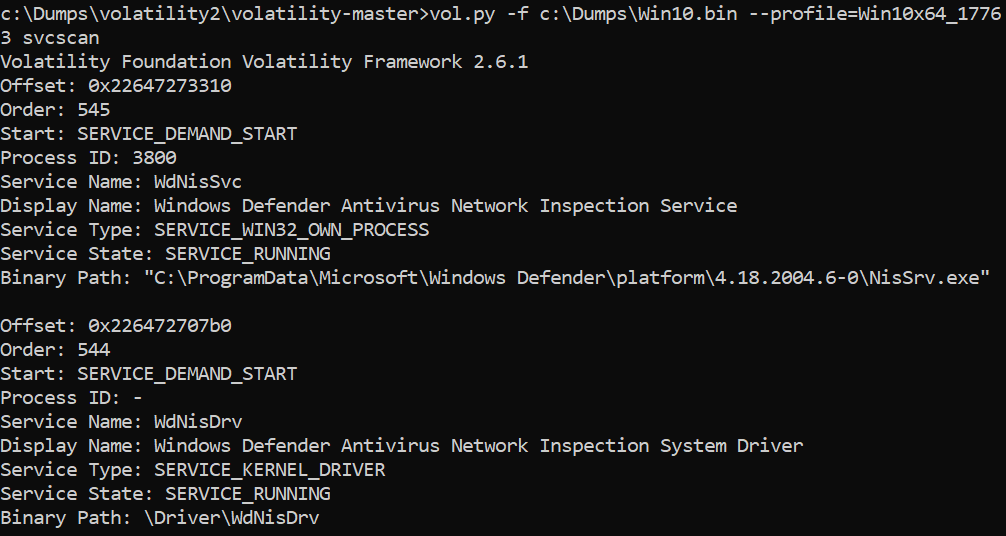
We can, of course, add some filtering on the top of it, have a look:
>vol.py -f c:\dumps\win10.bin –profile=Win10x64_17763 svcscan | findstr “Binary Path”

An interesting command is the ‘modules’ parameter – it allows to list all modules, like libraries, executables, drivers running in the operating system:
>vol.py -f c:\dumps\win10.bin –profile=Win10x64_17763 modules

We can also list the modules for a process (by PID):
>vol.py -f c:\dumps\win10.bin –profile=Win10x64_17763 ldrmodules -p PID <- you need to specify here chosen PID

Can we list devices connected to the current computer?
>vol.py -f c:\dumps\win10.bin –profile=Win10x64_17763 devicetree

If you find something strange, you can list active IRP’s!
You can even wish to see the screenshots of the desktops from all sessions (Make sure to choose an existing directory for the output):
>vol.py -f c:\dumps\win10.bin –profile=Win10x64_17763 screenshot -D c:\dumps\screenshots\
Maybe it’s not the best possible picture quality but it gives a clue!
So, in the end here come some tasks!
1. Find the PID of the service process hosting Eventlog.
2. What other services are hosted in this process?
Tip: You can try other commands from the list of available:
https://code.google.com/p/volatility/wiki/CommandReference23
We hope that after this quick memory analysis walkthrough you now see that just as it is crucial to understand operating system internals and security aspects, it is equally critical to understand what’s in the operating system’s memory. Hopefully, you can’t wait for the upcoming episodes! We can’t!
Stay safe!
CQURE Experts
Learn more about our offer in terms of Consulting. Our Cybersecurity Experts perform consulting work on a daily basis, hence we are fully prepared for any challenge.
Lorem ipsum dolor sit amet, consectetur adipiscing elit. Ut elit tellus, luctus nec ullamcorper mattis, pulvinar dapibus leo.