How you ever wondered what is causing THAT traffic on your network interface card? The network administrators tend to perform network traffic monitoring by capturing the network data and analyzing the packets being sent from one server to another. In this episode, we will discuss how to capture and analyze network traffic using the Wireshark, etl2pcap, netsh, and logman tools.
First of all, to start the monitoring we need the appropriate tools, this Episode will rely on Wireshark that can be downloaded here: https://www.wireshark.org/.
We will use the technique of passive sniffing, it allows us to scan the network traffic without interfering with the network. Let’s begin! Go to your toolkit and open Wireshark with administrative privileges.
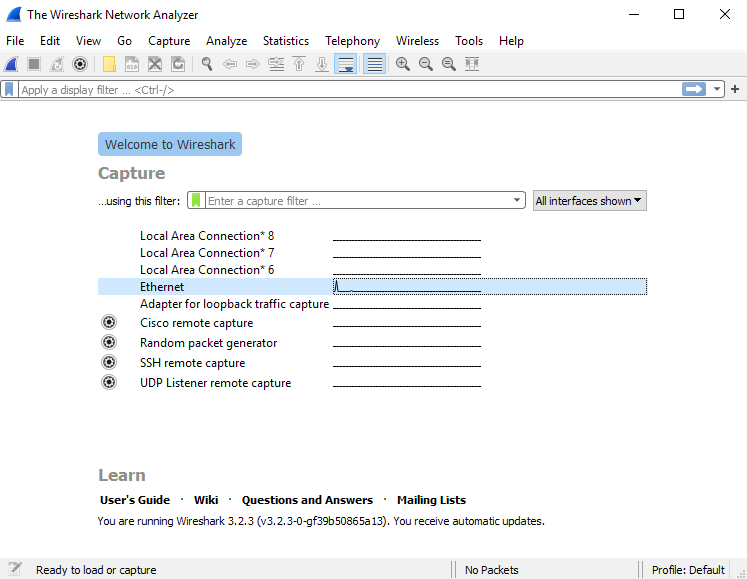
From the list select the network interface that you want to use for monitoring:

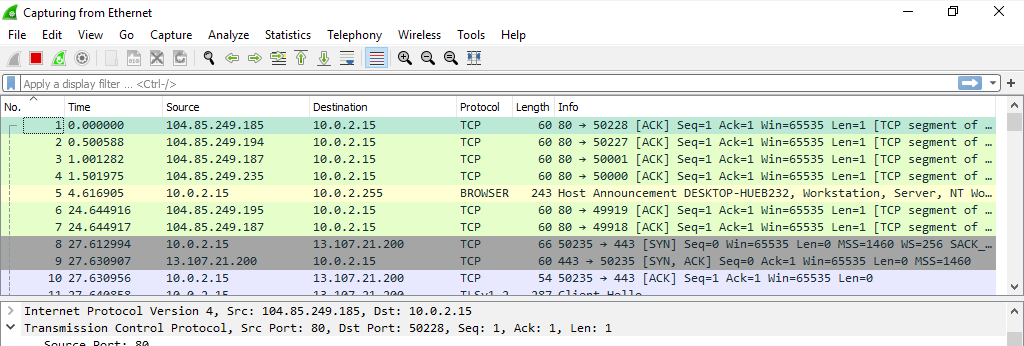
Once you double click on the interface you chose the capture will start immediately. Wait for around 1 minute, feel free to visit a website to generate some traffic. To stop the capture, click on the red square in the top left corner next to the shark fin.
Wireshark is giving us a lot of information here. First, we have the “Packet List” pane which is the colorful part of the window you see above. It displays a summary of each captured packet. By selecting a packet in this pane, we see more detailed information displayed in the other two panes. In this case, we selected packet number one.

Next up is the “Packet Details” Pane which shows the more detailed information about the currently selected packet. The fields which are enclosed in square brackets “[” and “]” are not present in the captured data, this is additional protocol information generated by Wireshark itself.

And the final pane is “Packet Bytes” pane which shows the data of the selected packet in a hexdump format.

To filter packets by a specific protocol just type the protocol name above the Packet List pane.

To get more details about the connections made open cmd.exe and type netstat –anb | more. Find destination port / destination IP address in the result, review the traffic and try to find the processes that are responsible for certain communication types.
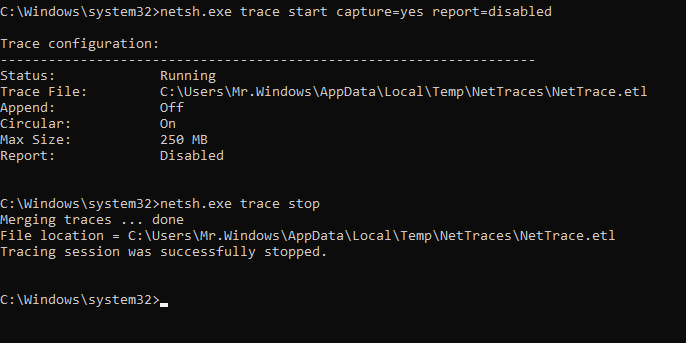
Windows comes out of the box with a command-line utility called “netsh”. A capture can be collected using these commands in cmd.
netsh trace start capture=yes report=disabled
netsh trace stop

Make sure you generate some traffic during collection. The file generated is in etl format. This could be opened by tools like Microsoft Message Analyzer, but not by Wireshark. Microsoft Message Analyzer is a tool that is now retired, luckily for us etl2pcapng exists. As you can probably guess from its name it converts etl format to pcapng which can be opened by Wireshark.
You can get prebuilt binaries of etl2pcapng here: https://github.com/microsoft/etl2pcapng/releases

To use this tool simply navigate to where it was downloaded and if you moved the file generated by the previous command to the same location you can simply convert it as seen above.
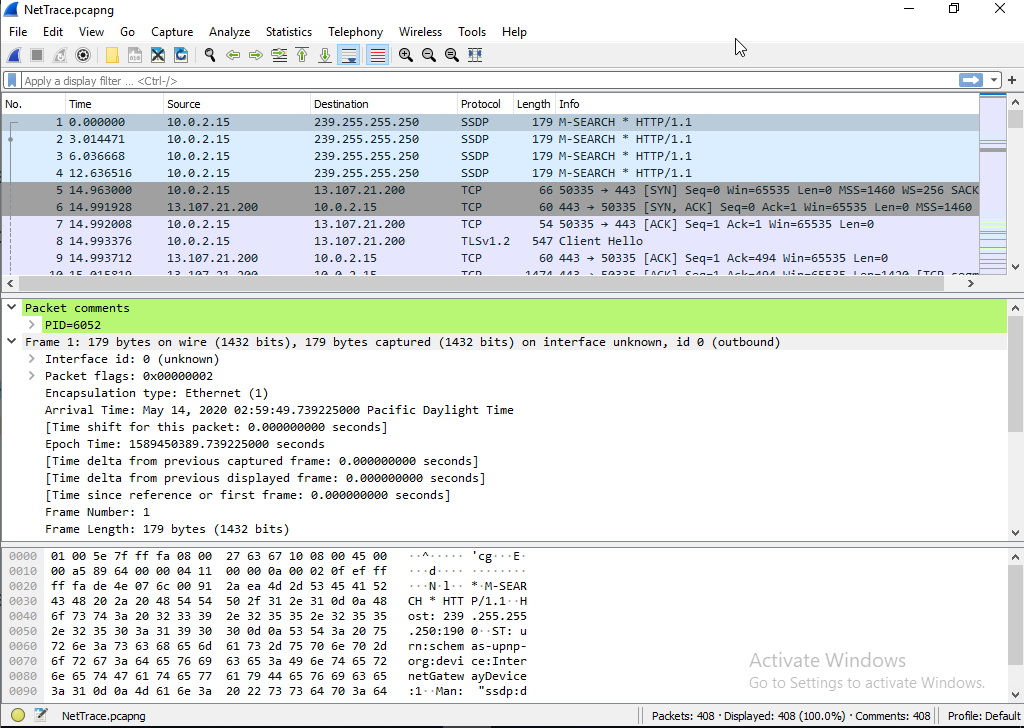
Once that is done the last thing to do is to open the pcapng file in Wireshark. This can be achieved by choosing the Wireshark toolbar File -> Open.

One thing to notice is that packets now have PID of the current process when the packet was logged visible in the Packet comments. Keep in mind that the PID shown might not be the actual PID of the process which sent the packet or which received it. The reason being that packet capture provider often runs in a DPC (Which often runs in an arbitrary process).
An interesting situation happens when the process responsible for communication is named System. What should we do then to find out who is responsible for this type of communication? ETW! Let’s use Windows (ETW) to trace the HTTPS communication.
Open cmd.exe with administrative privileges. Now we will perform the Winsock tracing to get more information about the communication. The following command starts Winsock Catalog Change, type it in cmd.exe:
Cd c:\HackingSeries (or some other folder rather than c:\windows\system32…)
logman start -ets HackingSeriesSession -o hss.etl -p Microsoft-Windows-Winsock-AFD
Now we should wait for the intended communication to happen, in our case, we can wait for around 60 seconds. The log will be created in the folder that you were when starting logman. In the cmd.exe console type the following command to stop the trace:
logman stop -ets HackingSeriesSession
In the cmd.exe type the following command to convert *.etl file to *.txt:
tracerpt.exe hss.etl -o evidence.txt
Go to the HackingSeries folder, open evidence.txt. Browse through the recorded events to find footprints of the traffic that was initiated by the System process (hint: search for the destination IP address). You should see the event similar to the one below (the log was shortened for the purpose of this episode):

If you search in the log for the Destination IP and search for the related Process ID you have just found which process is responsible for this traffic! PID (Process ID) can be found in Task Manager or Process Explorer.
What we just did is pretty awesome – by knowing internal operating system mechanisms we were able to sniff the traffic not only by using the network sniffing tools but also by using the built-in tools that allow us to monitor the usage of Winsock. If you want to check if any host is transmitting passwords in clear text, you can see it in the Credentials tab!
Stay safe!
CQURE Experts
Learn more about our offer in terms of Consulting. Our Cybersecurity Experts perform consulting work on a daily basis, hence we are fully prepared for any challenge.
Lorem ipsum dolor sit amet, consectetur adipiscing elit. Ut elit tellus, luctus nec ullamcorper mattis, pulvinar dapibus leo.